

Most application security programs can say what they did last quarter. Far fewer can say whether it worked. The Measure and Improve stream of OWASP SAMM exists to close that gap.
This article is community guidance for the Measure and Improve stream in SAMM’s Strategy and Metrics practice. The related OpenCRE entry is Steer the secure software development program. The metrics below focus on software development in R&D teams. Operational security metrics, such as patch levels of production servers or phishing click rates, are a different topic.
What makes a good metric
According to SAMM, the purpose of these metrics is to measure the effectiveness and efficiency of your application security program. Keep that in mind while you build the list. Every metric should tell the application security team something it needs to know to reach its own goals. A metric nobody acts on is overhead.
Each metric also needs to be:
- measurable in the same way every time, so trends mean something
- cheap enough to collect, ideally automatically from tools you already run
- expressed as a number or a percentage, with a clear unit
Write each metric down with its name, formula, unit, data source, collection frequency and owner. That one line of documentation prevents most arguments about the numbers later.
Three categories: effort, result and environment
At maturity level 1, the security team captures metrics in all three categories SAMM defines: effort, result and environment. What matters most is understanding how effort and environment metrics affect the result metrics.
That link is also what you take to management. Results are what executives care about, but they can only invest in effort. If you can show which efforts move which results, investment decisions become much easier to justify.
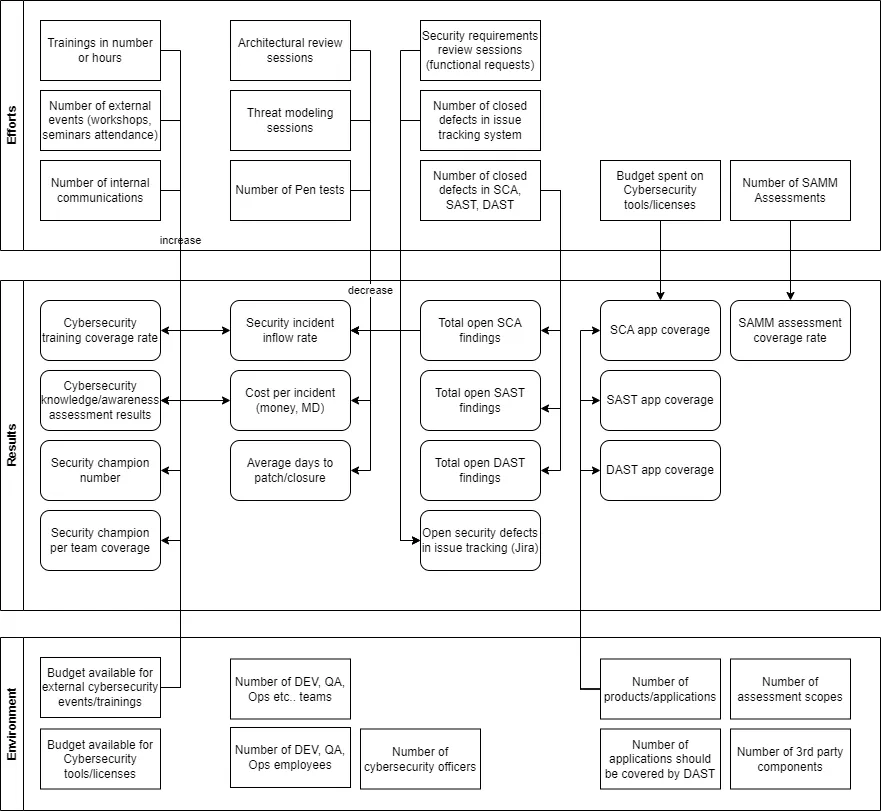
The map below shows example metrics in each category, with lines for how they influence each other. Use it as a starting point and adapt it to your own program’s goals.
Effort metrics
Effort metrics measure how much work goes into security activities. They mostly count activities that don’t represent results on their own but help you achieve them.
Examples:
- number of security trainings, or total training hours
- number of external security events attended, such as workshops, conferences and community meetings
- number of internal security communications
- time spent on security code reviews
- number of architecture review sessions focused on security
- number of threat modeling sessions
- number of penetration tests
- number of review sessions for security requirements in functional requests
- number of security defects closed in your issue tracker, such as Jira
- number of findings closed in SCA, SAST and DAST tools in a given period
- budget spent on security tools and licenses
- number of OWASP SAMM assessments carried out
Result metrics
Result metrics measure how effective the security effort is. At maturity level 2 of this stream, you choose the most important of them as the core KPIs of your application security program and set targets for them.
Examples:
- security training coverage: people trained divided by people who should be trained
- security awareness: average scores from quizzes or surveys after training
- total number of security champions
- security champion coverage: teams or products with at least one champion divided by all teams or products
- security incident inflow: new incidents reported in a given period
- cost per incident, in money or person-days
- average time to patch, or to close an incident
- tool coverage: applications or repositories scanned by SCA, SAST and DAST divided by those that should be
- open SCA findings, or the total risk score of third-party dependencies
- critical vulnerabilities in third-party components older than 90 days
- open security findings from SAST
- open security defects in your issue tracker
- service levels: average time to fix security defects and incidents, and their total cost in person-days
- SAMM assessment coverage: scopes with a recent assessment divided by all scopes
Environment metrics
Environment metrics describe the context the security work happens in. They help you understand the scope and complexity of the program. They don’t need to be tied to security tools or activities, but you need them as inputs for the result metrics, mostly as the denominators of coverage rates.
Examples:
- number of scopes in the organization used for SAMM assessments
- total number of products or applications
- number of products or applications that should be covered by DAST
- number of third-party components in use
- total number of development, QA and operations teams, and the people in them
- budget available for external security events and training
- budget available for security tools and licenses
- number of security officers
How the categories connect
A few of the relationships from the map show how this works in practice:
- More training hours should raise training coverage and awareness scores, and grow the number of security champions.
- Threat modeling sessions, architecture reviews and penetration tests should lower the incident inflow, the cost per incident and the time to patch.
- Closing SCA, SAST and DAST findings lowers the number of open findings, as long as new findings don’t come in faster.
- Budget spent on tools raises SCA, SAST and DAST coverage, measured against the number of applications from your environment metrics.
- Running SAMM assessments raises assessment coverage, measured against the number of scopes.
When a result doesn’t move although the effort went up, that’s worth a conversation. The effort may be aimed at the wrong thing, or the environment may have grown faster than the program.
Metrics for CRA preparation
If you make products with digital elements for the EU market, the Cyber Resilience Act gives some result metrics a legal edge. These are worth adding to your list:
- products with an up-to-date SBOM divided by all products in scope
- products with a defined and published support period
- median time to fix critical vulnerabilities in supported product versions
- critical vulnerabilities in third-party components without a fix or mitigation plan
- products covered by a published coordinated vulnerability disclosure policy
- time from becoming aware of an actively exploited vulnerability to the 24-hour early warning, measured in exercises before you need it for real
Our CRA guide for SMBs explains the obligations behind them, and OWASP Dependency-Track can supply several of the SBOM and third-party vulnerability numbers automatically.
From metrics to KPIs
Defining and documenting your Measure and Improve metrics is the step before maturity level 2, where you pick the KPIs from your result metrics and set targets for them. Start small. Five metrics you collect reliably every month are worth more than thirty you collect once.
If you’d like an independent view of where your program stands, our SSDLC maturity assessment uses OWASP SAMM to score your current practices and build an improvement roadmap.